Commas used as decimal points instead of dots in the Swedish setup of Excel.
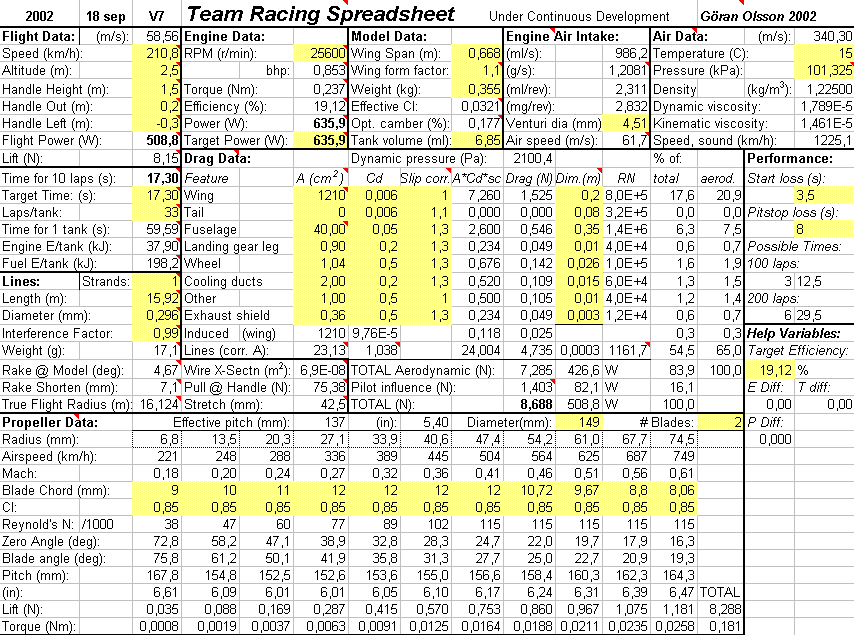
| Team Racing Calculator Spreadsheet |
To sort out these things at the engineering stage rather than at the
field, I have designed this Excel application, that gives an overview of
the physics and aerodynamics influencing a Team Racing model in flight.
Here I display a non-interactive web version of the spreadsheet. The
actual Excel file allows the user to change things and see how the
changes affect performance.
Metric units are used throughout. In a few cases, inch and BHP
conversions have been added.
You can download the Excel files, see below.
An example spreadsheet:
Download:
Spreadsheet V7 for Excel (2009 version for 0.35 mm lines) (111 kb)
The spreadsheet is in constant
occasional development, so look out for updates.
The spreadsheet has macros for certain operations. When you open it you
get a box cautioning you. You should select "Enable Macros".
For the handle position, some prefer giving this as a radius from the centre of rotation to the handle plus the angle from the straight line between the model and this centre. In the way I give it, see the comments, the numbers .2 m and -.3 m correspond to a radius of .3605 m and an angle of -56.3 deg.
The "Speed" field, found in upper left corner, is used to calculate most
things. However, the normal input you have is a time for ten laps. This
you could enter in the "Target Time" field. If the "Time for 10 laps"
field says something else, you use a macro to adjust the speed so this
value becomes equal to your "Target Time". First, however, change all the
other yellow fields to match your setup.
You reach the macros by pressing Alt-F8.
Click on the row "SetSpeedForGivenTime" and press run. Now the speed
is changed so that the "Time for 10 laps" corresponds to your "Target Time".
After you have set up everything, and want to use this as a reference
case to compare everything to, also run the macros SetTargetEfficiency
and SetTargetPower.
Now you are setup and ready to change something and see how it affects performance.
Find the line diameter field and change the value by .01 (from .296 to
.306 in the above example)! A lot of values will change. For instance,
the Power is no longer equal to the Target Power, but has increased by
around 9 watts. As the available power hasn't changed, you want to see
the effect on the speed. This you do by running the macro
SetSpeedForGivenPower. The new speed and time for 10 laps will be
calculated. It turns out you will go around .09 seconds slower for 10
laps.
This, however, assumes that you can keep the engine power. As the speed
has gone down a bit, flying your range (of 33 powered laps) will take a
little more time, and therefore you have to reduce the engine power to
keep the range. You probably will be reducing the venturi diameter or
something similar. In the spreadsheet you can, instead of assuming
constant engine Power, say that the Engine Efficiency is kept. Then you
run the macro SetSpeedForGivenEfficiency. After this you see that you
will go around .13 seconds slower for 10 laps.
In Reality the result will probably be something else,
but the calculated result would be valid if everything else were adjusted to
the new situation.
I'm aware that these hints don't amount to anything near complete instructions. Don't hesitate to e-mail me if you have questions as well as ideas for improvement.
The Propeller Data part is merely for orientation. To make a propeller design, check Martin Hepperle's site. You can take the input parameters from the spreadsheet!
Another comparison: Let's say you spend a lot of effort making a retracting landing gear. This gives you the same advantage as moving the handle FOUR CENTIMETERS to the left! Maybe the effort is better spent refining pilot technique?!
Good luck,
I'm indebted to Pete Soule for pointing to errors and for general discussions.